
Introduction
Many people believe that drinking more of water makes you healthier. But I wonder how can I analyzed that through data. I want to examine the following question in detail.
Does drinking a lot of water make you healthy?
To answer it, I use a public data set to explore whether drinking a lot of water relates to health. I will focus on weight and hydration level as measurable indicators of health wellness while acknowledging the limitations of using these variables.
Approach
I will use the dataset from Kaggle.com. Based on this dataset. I will do the following
- Clean the Data to match the requirements of the analysis
- Present the Data by organizing and visualizing the key relationships.
- Summarize the Data – Based on my visualisation, I will answer this question.
Clean the Data
Setup
I will use R Programming Language for this project, primarily through the package tidyverse, which provides tools for data cleaning, data transformation, and data visualization.
#Installing and Load required packages

#Installing Packages
install.packages("tidyverse")

#Load Packages
library("tidyverse")
Next, I load the dataset. I will assign the variable water_consump to the dataset for reused throughout the analysis.
#Reading and assigning the variable
#to the dataset

water_consump = read_csv
("Daily_Water_Intake.csv")
This produces the dataset shown in Table 1.
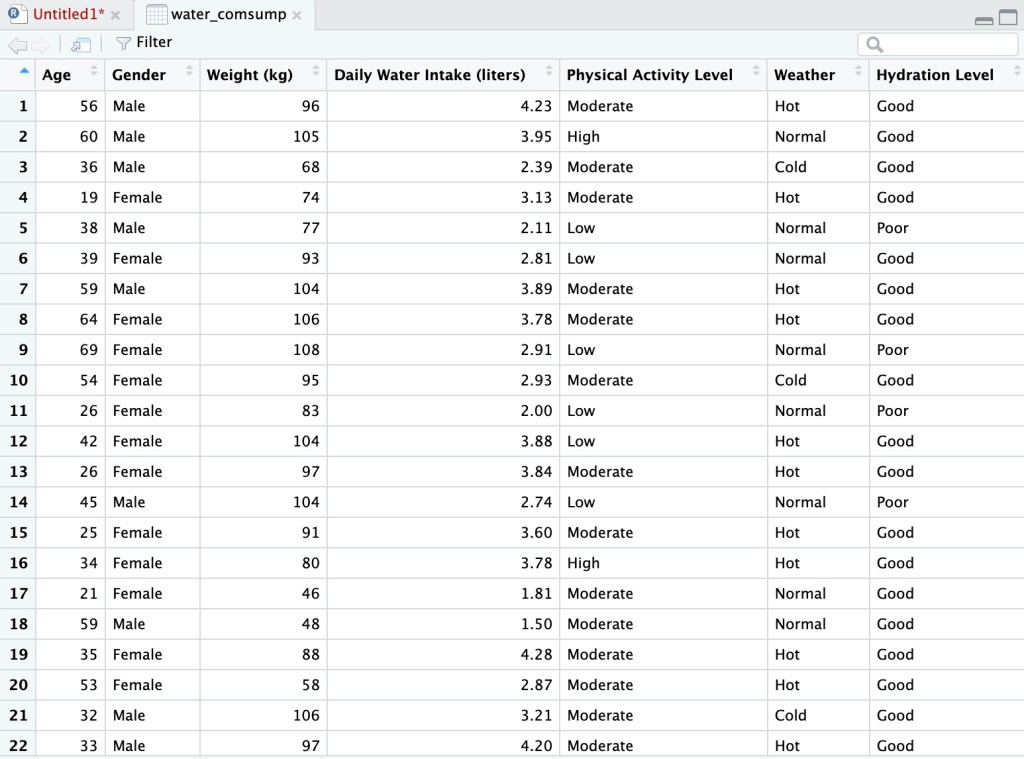
The dataset contains seven variables:
- Age
- Gender
- Weight (in kg)
- Daily Water Intake (liters)
- Physical Activity Level
- Weather
- Hydration Level
The analysis focuses on how Daily Water Intake relates to two indicators:
- Weight
- Hydration Level
These variables are used as measurable proxies for health, with the understanding that they do not fully capture overall wellness.
Identifying Variables to Control
To make it a fair test, I can choose to control several variables that could influence the results. These variables are
- Age (grouped)
- Gender
- Physical Activity Level
- Weather
Age requires additional processing because it is not categorical. Let’s look at the age data and how they are distributed by looking at its minimum and maximum.
#Look at the range of the age

#Create 2 new columns minAge, maxAge
#which determine the minimum and
#maximum of the age

ageData = water_consump %>%
  summarise(minAge = min(Age),
            maxAge = max(Age))

So the age spans from 18 to 69. I decided to group ages as follows
| Age Group |
| 18-29 |
| 30-39 |
| 40-49 |
| 50-59 |
| 60-69 |
I decided not to group 10-19 because I feel that there would be too little data to analyze in comparison with other grouped ages.
This gives me a set of variables that can be categorized as follows.
| Varied Variable | Measured Variables | Constant Variables |
| Daily Water Intake | Weight | Gender |
| Hydration Level | Age | |
| Weather | ||
| Physical Activity Level |
This structure allows me to isolate how water intake relates to selected health indicators while controlling other constraints.
Present the Data
The goal of this section is to examine whether daily water intake is related to measurable indicators of health. I focus on two relationships:
- Daily Water Intake vs. Weight
- Daily Water Intake vs. Hydration Level
Based on common assumptions, I begin with the following hypotheses
- Daily Water Intake vs. Weight should show a negative correlation
- Daily Water Intake vs. Hydration Level should show a positive correlation.
First I create two different datasets namely:
waterdset1– showingdaily water intakeandweightwaterdset2– showingdaily water intakeandhydration level
#Generating 2 subsets of the dataset

#Dataset1: Daily Water Intake vs Weight
waterdset1 = water_consump %>%
  select("Daily Water Intake (liters)",
             "Weight (kg)")

#Dataset2: Daily Water Intake vs Hydration Level
waterdset2 = water_consump %>%
  select("Daily Water Intake (liters)",
             "Hydration Level")
This generates 2 different tables.
Table 1: Daily Water Intake vs. Weight
I’m going to focus on Table 1 first. Recall that my hypothesis is:
Daily Water Intake vs. Weight should be inversely proportional
I will use scatter plot to visualize this.
#Scatter Plot for Daily Water Intake vs. Weight
ggplot(waterdset1,
aes(x = `Weight (kg)`,
y = `Daily Water Intake (liters)`)) +
geom_point(size = 0.000000001, color = "blue") +
theme_minimal()
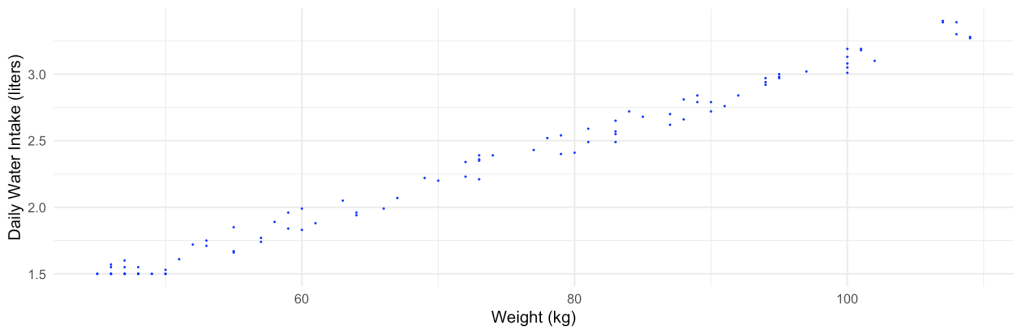
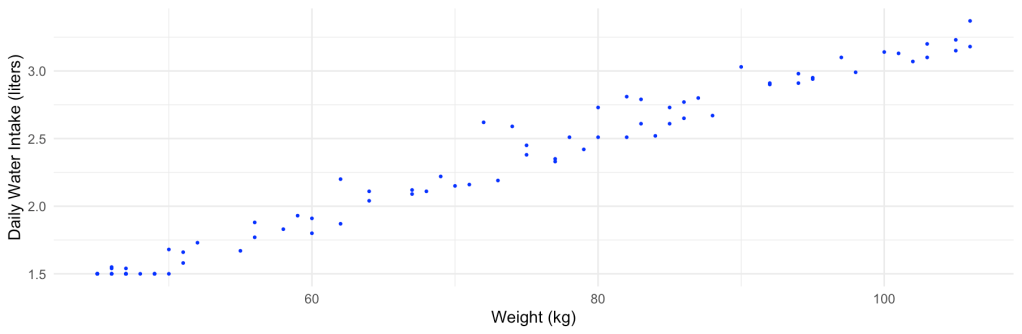
This gives me the following plot

Contrary to the hypothesis, this plot shows a positive correlation:
Drinking more water increases weight.
To examine whether this pattern is influenced by other variables, I apply additional constraints
- Gender = Male
- Physical Activity Level = Low
- Age = 18-29
- Weather = Cold
- Hydration Level = Good
Now that I chosen my constraints, I can visualize them
#Filter out table with constraints above
#for ages 18-29
filter_data_set1 = water_consump %>%
#insert constraints
  filter(Gender == "Male",
         `Physical Activity Level` == "Low",
         Age < 30,
         `Weather` == "Cold",
         `Hydration Level` == "Good")

#Scatter plot the graph
ggplot(filter_data_set1, aes(x = `Weight (kg)`,
       y = `Daily Water Intake (liters)`)) +
  geom_point(size = 0.1, color = "blue") +
  theme_minimal()
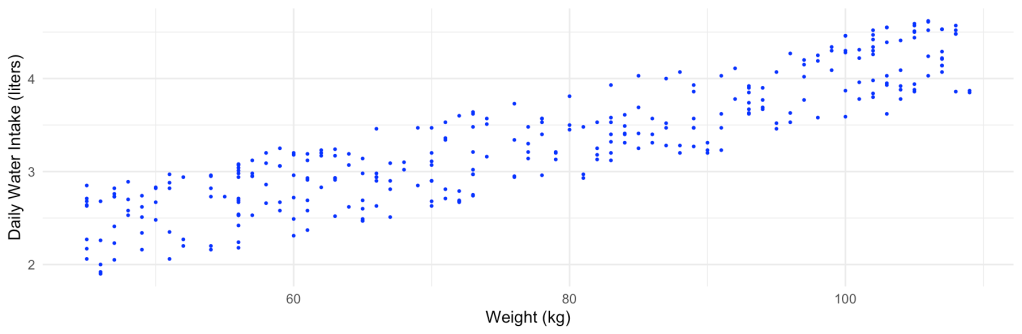
The results is shown here
Under these constraints, the plot shows an even stronger positive correlation. In simple terms
The more water I drink, the heavier I am
I try scatter plotting graphs with different constraints. Here are some of my results shown.
Physical Activity Level = Low
Age between 50 and 59
Weather = Normal
Hydration Level = Good
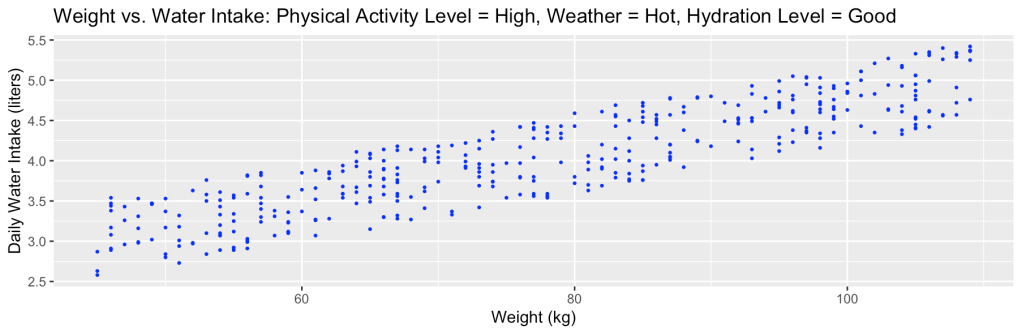
Physical Activity Level = High
Age between 30 and 39
Weather = Normal
Hydration Level = Good
No matter what constraints I change, It seems that weight is positively correlated to Water Intake. This suggests that
Water intake may scale with body size rather than reduce body weight.
Table 2: Daily Water Intake Vs. Hydration Level
Next, I examined the relationship between Daily Water Intake and Hydration Level. My hypothesis is that
The more water you drink, the more hydrated you are.
I will visualize this dataset using a box plot.
#Boxplot Water Intake vs. Hydration Level
ggplot(waterdset2, aes(x = `Hydration Level`,
y = `Daily Water Intake (liters)`))+
geom_boxplot() +
theme_minimal()

From this box plot here, I can see that
- The average line for
good hydrated personis higher thatpoorly hydrated person - The first and third quartile lines in
good hydrated personis higher thanpoorly hydrated person
This suggests my hypothesis claim above.
Hydration Level vs. Weight
Based on the previous findings, I explore whether hydration level itself is associated with body weight. I claim that
A hydrated person is healthy
I will use weight as a measurement of health.
My hypothesis is
The relationship between
hydrationandweightshould benegatively correlated
I will generate a new dataset first consisting of only weight and hydration level and box plotted it.
#Generating a new dataset weight vs water intake

weightHydration = water_consump %>%
  select("Weight (kg)", "Hydration Level")
##Boxplot Hydration Level vs. Weight

ggplot(weightHydration,
aes(x = `Hydration Level`,
  y = `Weight (kg)`)) +
  geom_boxplot() +
  theme_minimal()
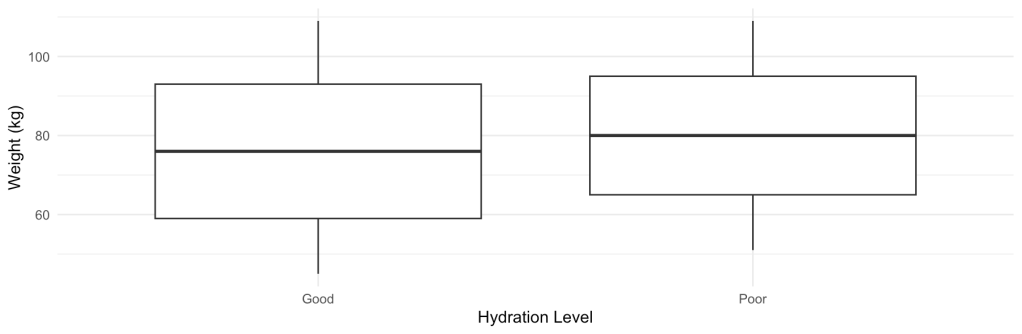
From this box-plot
- The first, second, third quartile line form
good hydratedlevel is slightly lower. This suggest a vaguely inversely proportional relationship.
I am going to apply constraints to make demonstrate a clearer relationship. To make this a fair I will
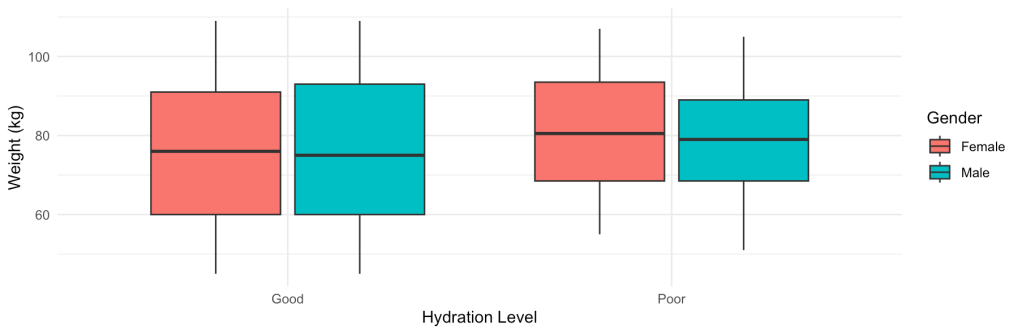
- Box plotted genders separately.
- Apply constraints on
- Physical Activity Level = Moderate
- Weather = Normal
#Filter Dataset weight vs. Hydration Level in detail
#Also sorting them by gender

weightHydrationD = water_consump %>%
  filter(Weather == "Normal",
         `Physical Activity Level` == "Moderate") %>%
  arrange(Gender) %>%
  select("Weight (kg)", "Hydration Level", "Gender")

#boxplot side by side separating by Gender

ggplot(weightHydrationD,
       aes(x = `Hydration Level`,
           y = `Weight (kg)`,
           fill = Gender)) +
  geom_boxplot() +
  theme_minimal()

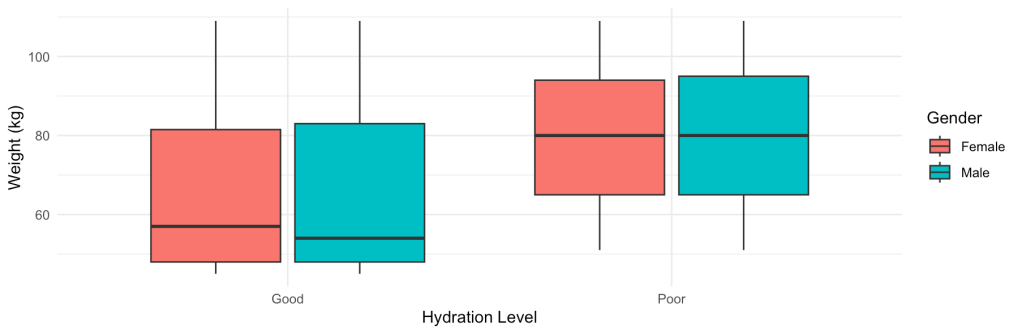
Constraints:
Physical Activity Level = Moderate
Weather = Normal
From this scatter plot, this stills confirms my hypothesis. The results are not that clear though I try running my test with varied constraints.
Constraints:
Physical Activity Level = Low
Weather = Cold
Constraints:
Physical Activity Level = High
Weather = Cold
From Box Plot 3 comparing to other box plots we’ve done so far
- The average line for weight for
good hydrationin both genders are significantly lower thanpoor hydration - The first and third quartile lines are significantly lower
With this, there is enough evidence to suggest that my hypothesis is correct.
An Interesting Observation
Here is an interesting observation. I’m going to compare Box Plot 3 with Box Plot 4 together. Box Plot 3 data shows the following correlation.
- Given that a person physical activity is low, drinking water reduces weight
This is because
- The average weight of a hydrated person is much lower than a dehydrated person when I compared my results to the other two box plots.
With Box Plot 4, when physical activity level is high, I can see that it is not that much higher. This suggests that hydration may play a more prominent role in weight-related outcomes when other health factors, such as exercise are limited. However, these findings indicates association rather than causation and should be interpreted accordingly.
Conclusion
This analysis explored whether drinking more water is associated with better health, using weight and hydration as measurable indicators.
The results show that
Water intake is positively correlated to body weight
This relationship remains even applying multiple constraints across age gender, activity level, and weather. As a result, weight does not support the initial hypothesis that drinking more water directly leads to lower body weight.
In contrast, the relationship between water intake and hydration level is positively correlated. People who drink more water tend to be more hydrated which supports the hypothesis.
While examining hydration level to weight, the results shows a vague negative correlation. The relationship becomes more stronger under certain conditions particularly when physical activity levels are low.
These studies suggest that weight alone is a poor measurement for health. From my additional research, I find out that a person’s body is compose of fat, water and muscle. A higher mass body will naturally required more water. Therefore, higher water intake does not necessarily indicate better health.
With my findings I concluded that drinking a lot of water makes you healthier because it makes you more hydrated. However, water isn’t the only factor that determines overall wellness. I
Others Factors
This conclusion I arrived at is not definite. In reality, there are other factors I need to consider such as
- A person’s height – so I can work out a suitable BMI
- A person’s body composition – The body composition consists of 3 things: muscle, water, and fat
- How does a person nutrition look like? – Are they on a diet or they are just fast fooding.
- The drinking behavior of a person – Did a person drink 4.5 liters of water in one go or did they drink 4.5 liters of water through sipping?
Moreover, these findings only suggests correlation not causation. Does drinking a lot of water increases weight? The correlation supports this statement but it does not prove it. The link relationship between
- weight vs. water intake
- hydration vs. water intake
also supports the idea of health very vaguely due to the factors I mentioned above.
Further analyses such as statistical hypothesis testing would be required to draw stronger conclusions about the role of water intake in overall health.
Disclosures
AI tools were used to assist with outlining, clarification, and editing suggestions.
All ideas, interpretations, and final writing decisions are my own.
References
Data Rockie – Data Science Bootcamp
Sonal Shinde – Daily Water Intake & Hydration Dataset

Leave a comment